
In our last blog, “Contingency Rates at 15% – No Way or Hell Yes?”, I discussed client profitability by taking a closer look at how to calculate correct commission rates for a new client. This week, I would like to take the conversation a step further by examining the profitability of existing client relationships.
- Do you fall into the trap of chasing cash flow instead of profitability?
- Do you know which clients are profitable?
- Do you know how many profitable clients it takes to carry each of your unprofitable accounts?
These are challenging questions to tackle given a large portion of firm and agency owners tend to spend their time focusing on client fees and payment terms (cash flow) rather than examining the profitability metrics associated with each client.
In my last blog, I shared a few formulas for calculating fee per file and cost per file in order to establish an understanding of how your income relates to your expenses. In order to truly understand if an existing client is profitable, we must delve into the costs associated with each client relationship.
When looking at the revenue side of the equation, we typically look at fee per file income at 12, 24 and 36 month forecasts. As a firm, we take it a step beyond the initial 36 month revenue outlay and account for the effects of post judgment execution as well as the existing payment arrangements that we setup in years 1 and year 2.
From here we like to group clients together by type of debt. Is this a creditor, debt buyer, auto paper, student loan, medical etc. Typically clients by segment will perform within 10% of each other unless they are doing something special with their strategy with the files before it gets to you. Examples would be only suing cease and desist accounts, only calling small balance accounts or only suing high balance accounts.
After clients are segmented by the type of debt, we ask the following questions:
- What is the mail return rate? How many accounts are being placed with a bad address? This is not an issue with most clients, however sending mail to bad address is a considerable waste of resources (letter, envelope, postage and employee time) to see it all come back.
- What is the dispute rate? Asking this question helps us understand the type of files being placed as well as how many additional resources it will take to succeed in comparison to other clients.
- What is the quality of the placement documentation? Will this client require an entire team to request, process and scan documents? Is this a manual work effort or is this an automated process?
- Are there any expectations in terms of how quickly you sue accounts? Is there a recall strategy in place? Clearly if you have more time to collect pre-suit and send letters than start legal the cheaper it is on a per file basis.
- How do they pay fees? Are they net? Do they short pay you? Do they pay you at 30, 60 or 90 days?
- How do they rank on the PIA scale (also known as pain in the ass)? Do they require constant attention? Do they require a dedicated staff that would not otherwise be necessary?
Asking these questions will allow you to gain a deeper understanding of each client relationship and how it impacts your bottom line. Ultimately this level of analysis should highlight if there are any outliers in your client portfolio that are driving up your total blended cost per file.
If you have a client that is not profitable, our experience is to tell them. You never know if they will adjust your commission rate because you run a great agency/firm and they don’t want to lose you. It is also possible to negotiate the items that are driving up the cost if you have enough data points to show them why they cost more than the typical client.
In order to do this you have to have great reporting. Below are some screen shots from the Surefire Platform that help users understand future collections as well as the other data points we discussed. Contact Us if you would like to Operate Smarter!
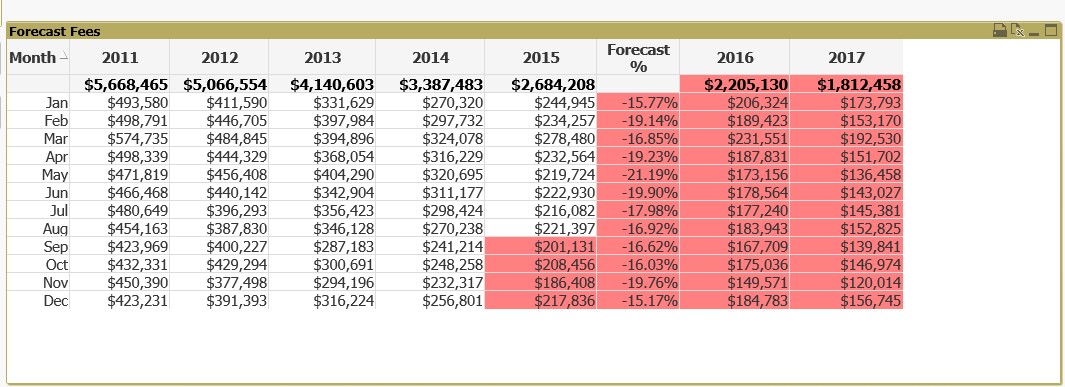
Surefire Platform – Operate Smarter
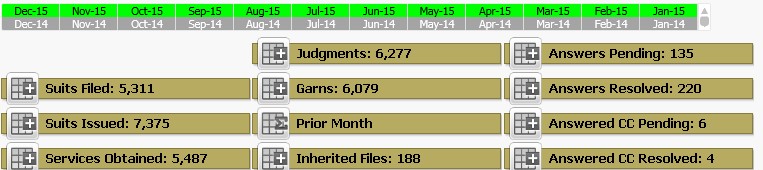
Surefire Platform – Operate Smarter
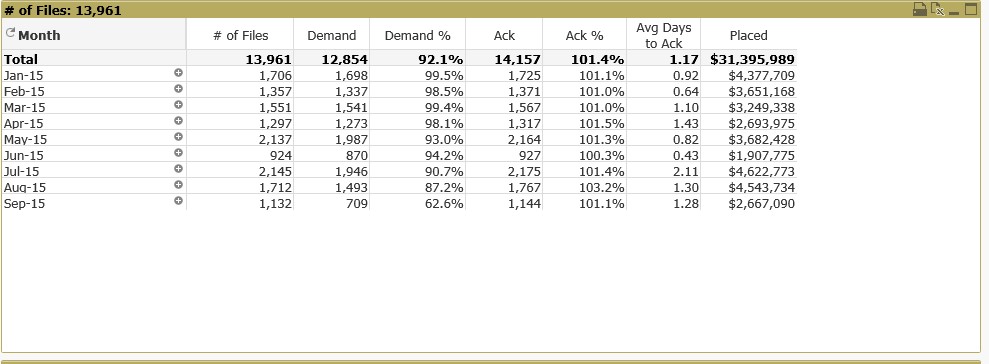
Surefire Platform – Operate Smarter
